Spectral Cytometry and Image Analysis
CytoSpec
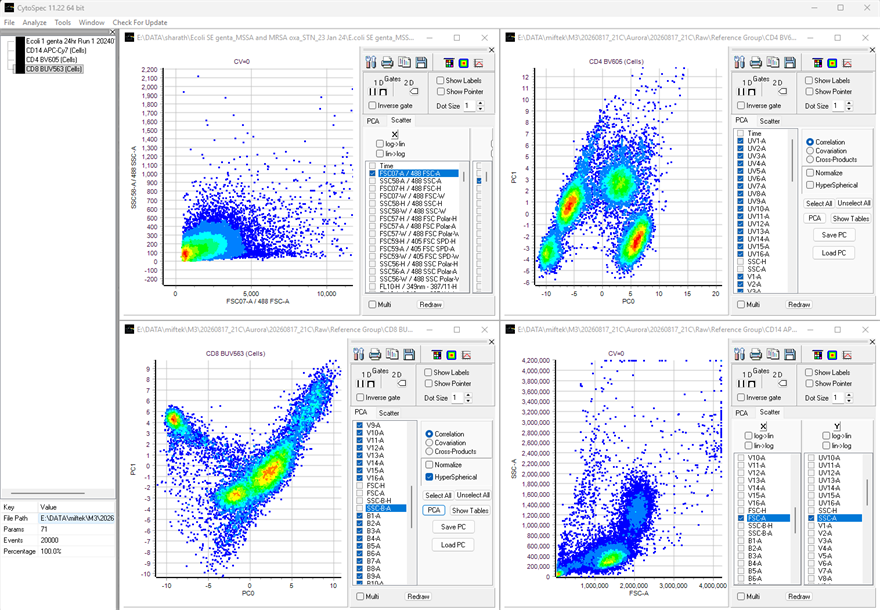
CytoSpec is a Windows research tool for multi-channel cytometry data, in which every event carries a whole spectrum. It reads flow cytometry files, spectral detector logs, text files and spectral images, and shows them as spectra, as scatter plots and through principal component analysis.
Gates drawn on any plot become new data sets that can be analysed further. Averages can be kept as reference spectra and used to unmix data into its dyes, and the pixels of spectral images can be classified by their spectra.
Windows 64-bit
Send comments to vpatseki_purdue.edu
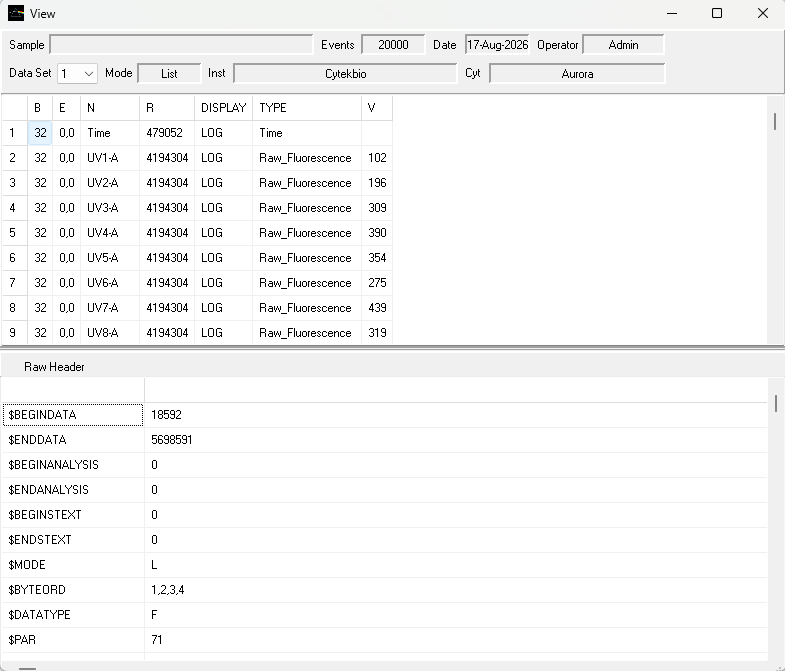
- FCS, LMD and other flow cytometry files, PhotoniQ detector logs, text files and plates
- Data Sets tree showing how every gated and derived data set was made
- 2D plots of channels or principal components, with correlation, covariance or cross-product PCA, normalisation and hyperspherical coordinates
- Polygon and 1-D gates that create new data sets; gates reusable through protocols
- Average spectra with error bars, distributions, time plots and scatter-plot matrices
- Phenotyping: marker-combination fingerprints of samples, as tables, heat maps and 3-D charts
- Dye spectrum library, a database of measured reference spectra, and spectral decomposition
- Spectral image stacks with pseudo-colour display, region selection, and SAM and decomposition classification
- Data transformations: logarithm, centred log-ratio, hyperspherical coordinates, channel deletion, joining, noise discrimination
- Export as FCS, CSV and multipage images
- Acquisition from supported spectral detectors
- User manual