
Software
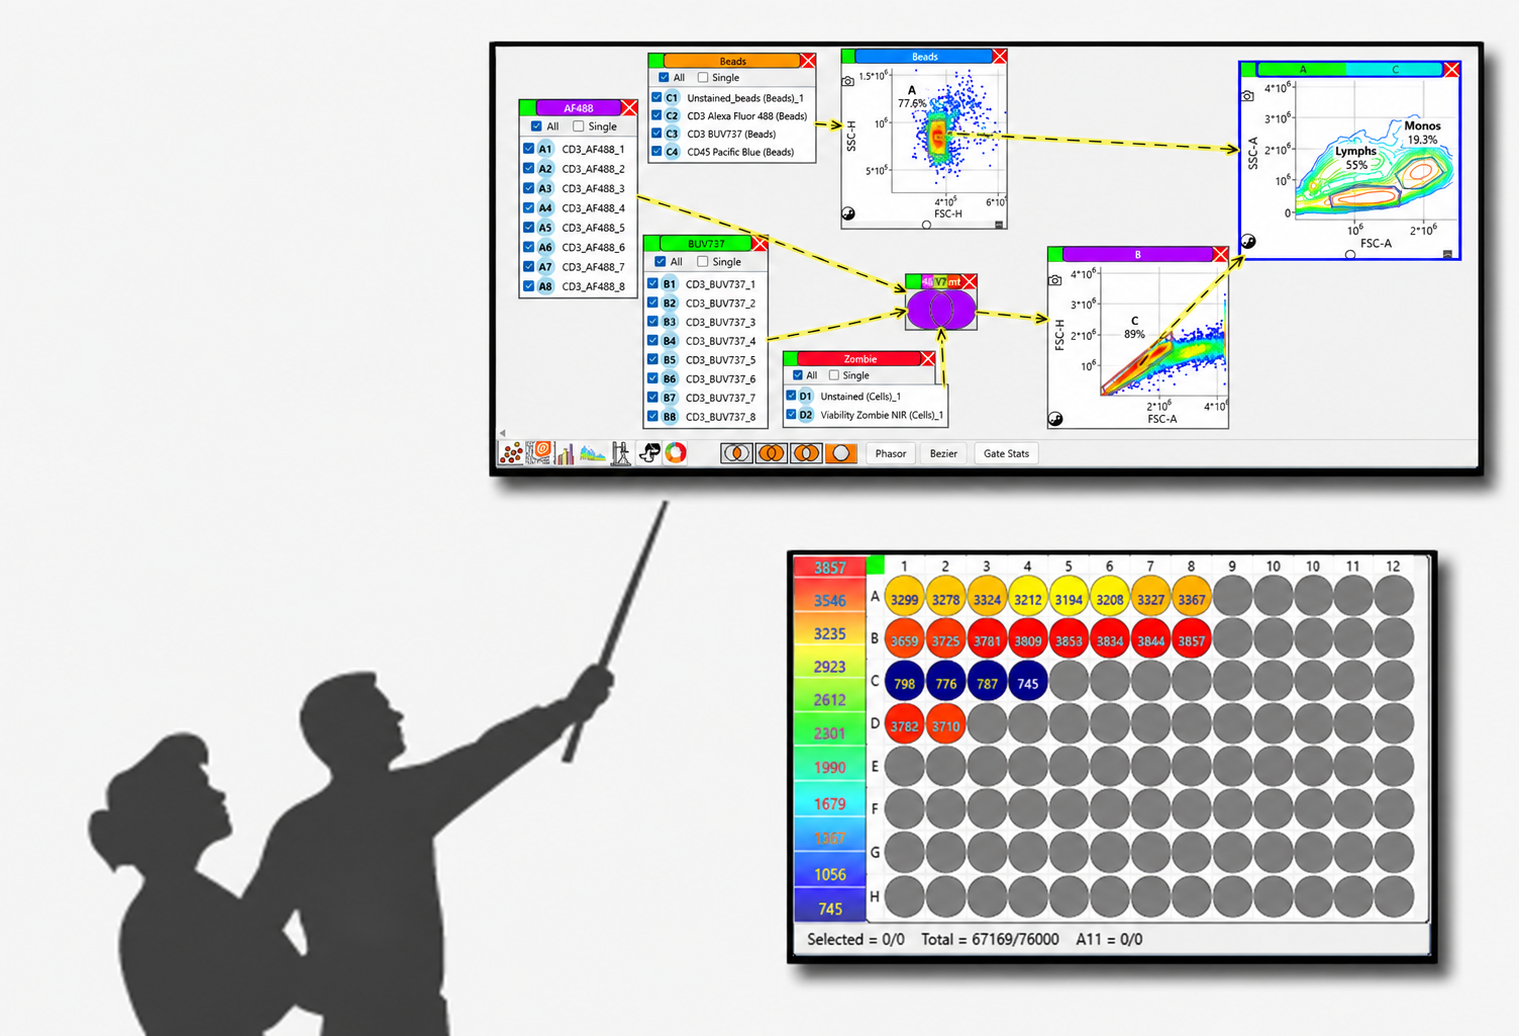
PlatAnJr
A Windows desktop application for high-throughput analysis of flow cytometry data. PlatAnJr opens single FCS files or a whole 96- or 384-well plate as one dataset, so a gate drawn once applies to every well, and a plate heat map shows the result well by well.
Analyses are built as a visual gating graph that redraws live, with compensation, spectral unmixing, cell-cycle fits and dimensionality reduction built in.
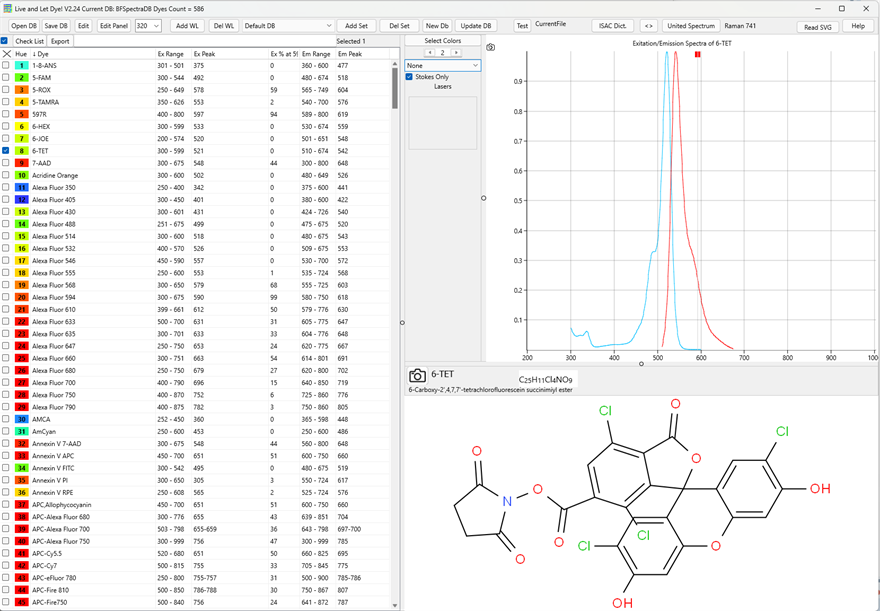
BFSpectra
A Windows desktop application for choosing fluorochromes. BFSpectra keeps a database of excitation and emission spectra of hundreds of dyes and, for a chosen cytometer, turns each dye into the signal it gives in every detector.
It shows how alike the dyes look to the instrument, picks the best-separated set for a panel, lays the panel out, and generates synthetic FCS files for testing spectral unmixing.
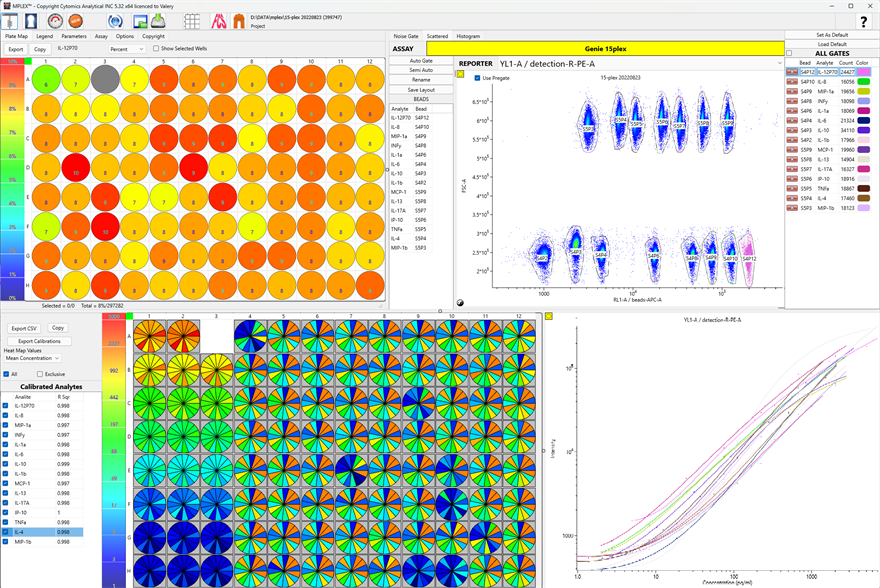
Mplex
A Windows desktop application for multiplex bead immunoassays - LEGENDplex, MILLIPLEX and other Luminex-type kits - read on a flow cytometer. Mplex separates and identifies the bead populations of a whole plate at once.
It fits a calibration curve for every analyte from the standard wells and reports the concentration of every analyte in every well, as heat maps and CSV tables.
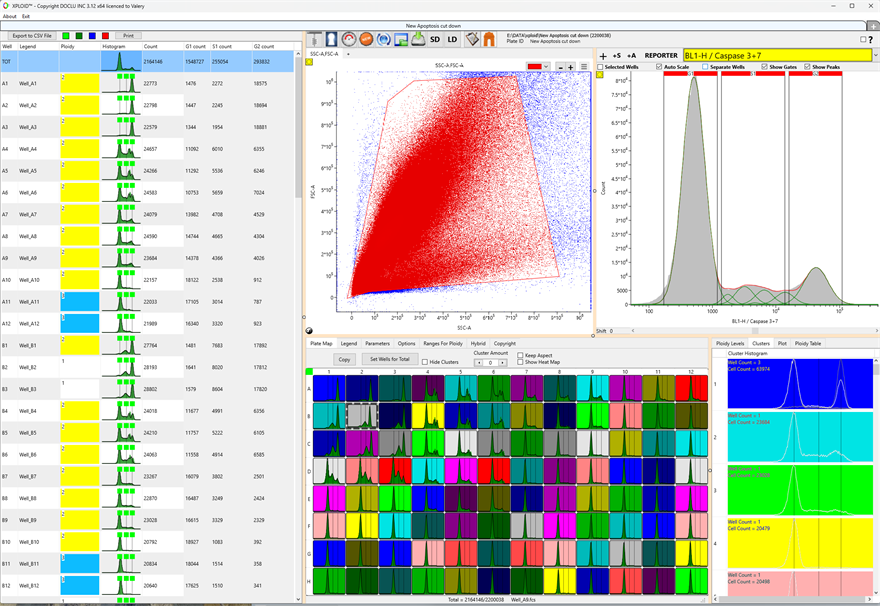
Xploid
A Windows desktop application for DNA ploidy analysis by flow cytometry. Xploid fits the peaks of the DNA histogram of every well on a plate and assigns each sample a ploidy level.
With an internal standard it reports C-values, ploidy levels and chromosome counts for hybrid and aneuploidy screening, and groups wells with similar histograms.
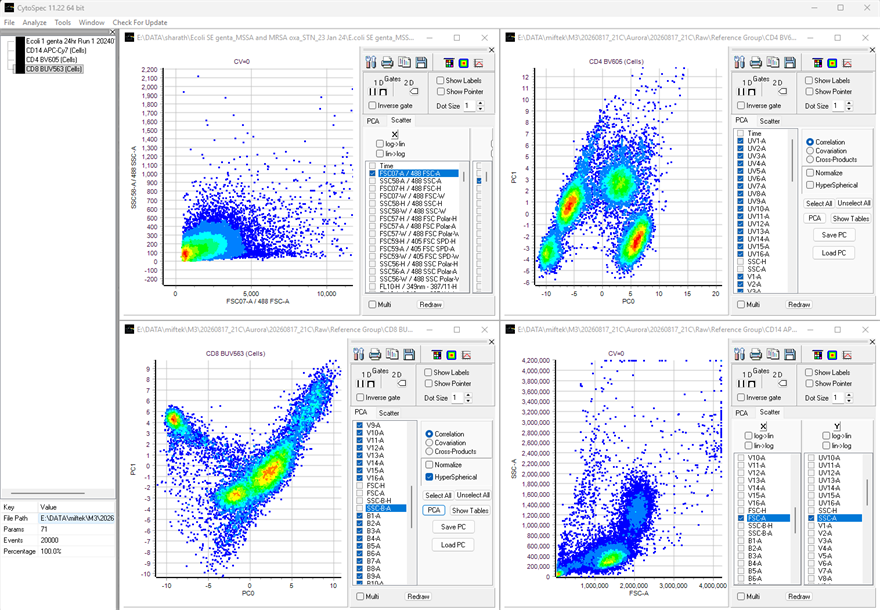
CytoSpec
A Windows research tool for multi-channel (spectral) cytometry data and spectral images. CytoSpec shows every event as a spectrum, as scatter plots and through principal component analysis.
Gates become new data sets, measured spectra become references for unmixing, and the pixels of spectral images can be classified by their spectra.
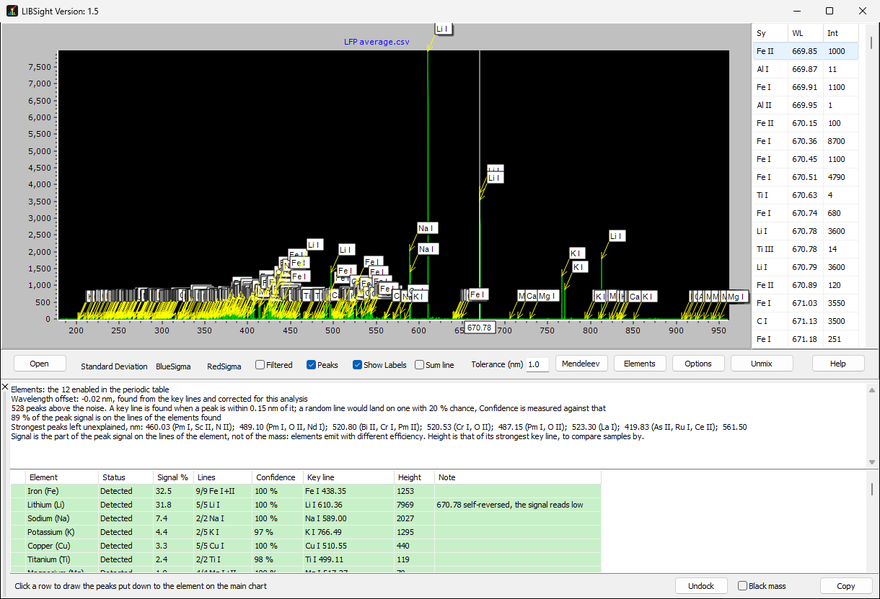
LIBSight
A desktop application for Windows and macOS that identifies the chemical elements in laser-induced breakdown emission spectra, using the lines of the NIST Atomic Spectra Database.
LIBSight labels every emission line with the ion that produced it, ranks the ions by their share of the spectrum, and unmixes samples against measured controls.
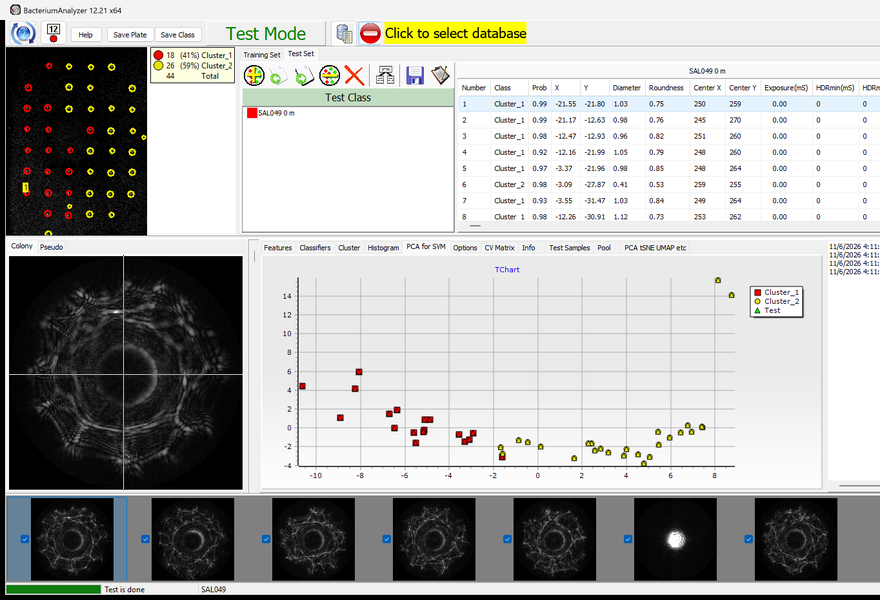
Baclan
A Windows desktop application that identifies bacterial colonies from their BARDOT scatter patterns. Baclan turns each colony's scatter image into numeric features and trains a support vector machine on colonies of known organisms.
It then classifies new plates colony by colony, with a probability for each, and can cluster and map colonies with no model at all.
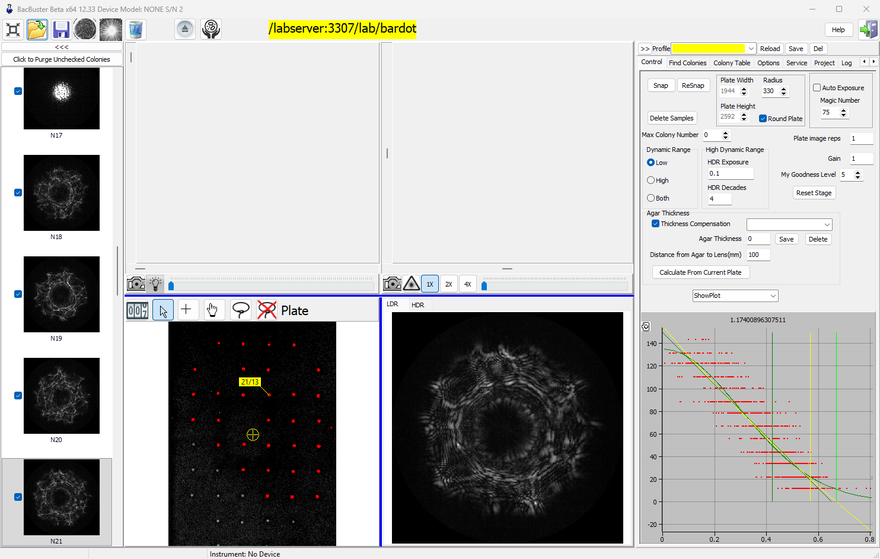
BacBuster
A Windows desktop application that runs the BARDOT instrument. BacBuster photographs a Petri dish, finds its colonies, and records the pattern of laser light each colony scatters forward - the images Baclan classifies.
It saves plates to a database or to files and, with a Cytomat incubator, scans them on a schedule around the clock.
ExpManager
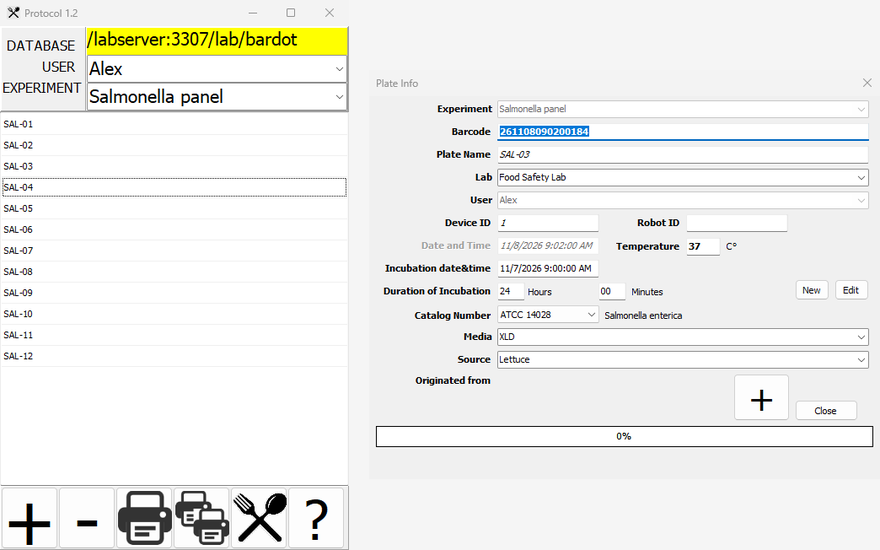
A Windows desktop application for planning BARDOT experiments. ExpManager enters an experiment's plates in the database, each with a barcode of its own and its description, and prints a barcode label for every dish.
When a dish is scanned, BacBuster takes its description from the database by its name or barcode.