
High Throughput Screening Software for Flow Cytometry
PlatAnJr
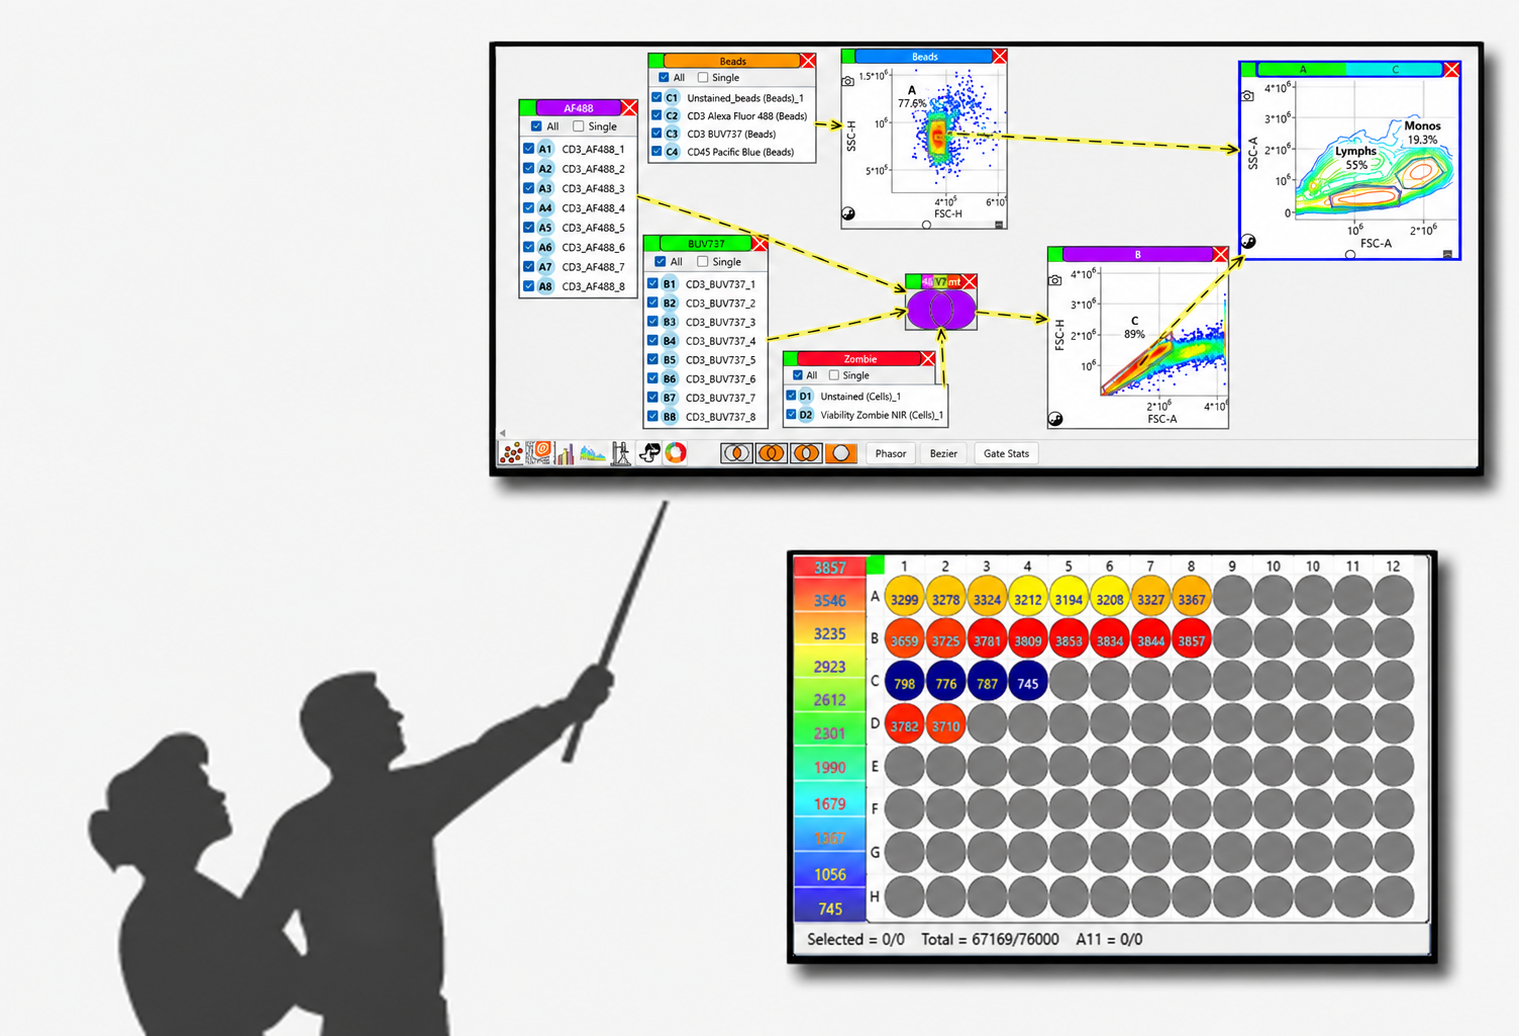
PlatAnJr is a Windows desktop application for analysing flow cytometry data. It opens single FCS files or a whole multi-well plate at once, loading every well into one dataset: a gate drawn once applies to every well, and the plate heat map shows, well by well, how many events passed it.
An analysis is built as a visual gating graph. Gates sit on nodes wired together by dragging, combine with AND, OR, NOT and XOR, and every downstream plot redraws as soon as a gate or scale changes. PlatAnJr also does compensation, spectral unmixing and cell-cycle fits.
Previous versions (release notes)
Send comments to vpatseki_purdue.edu
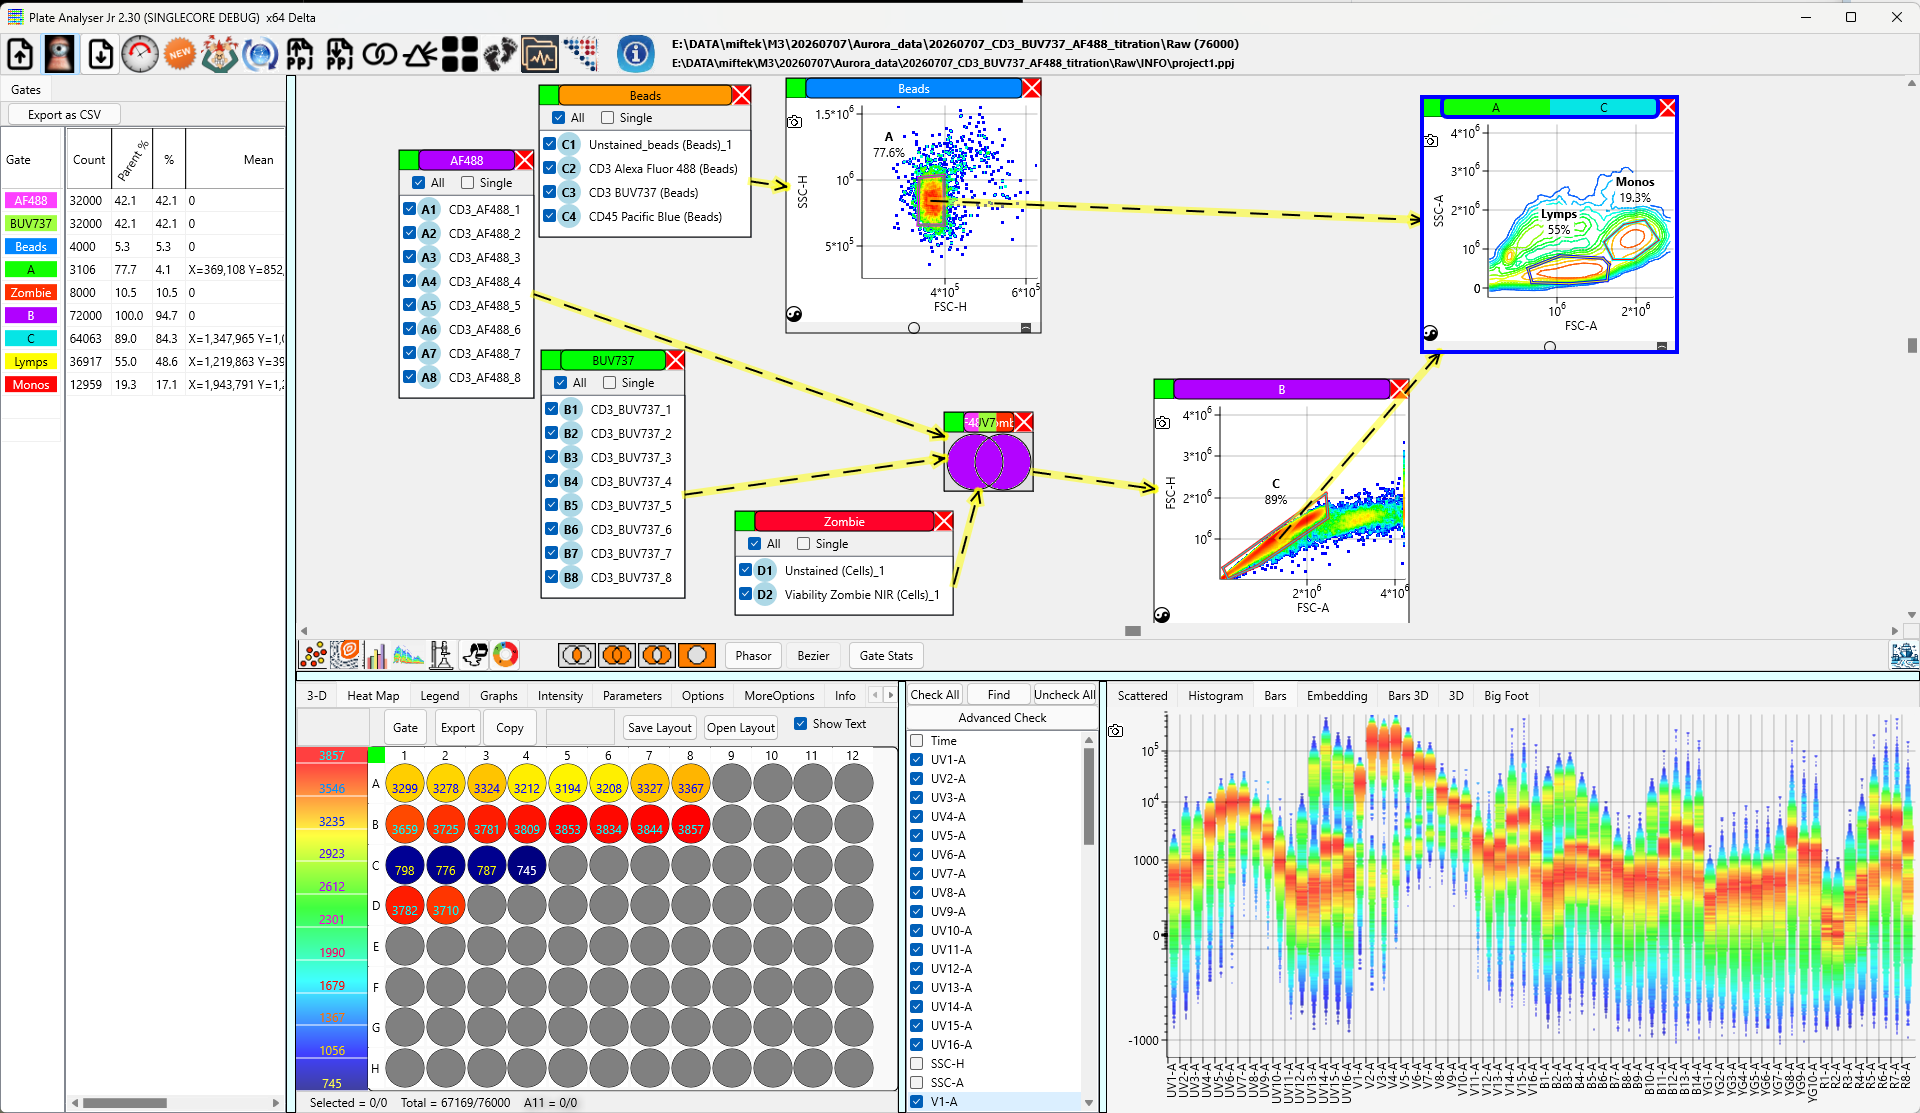
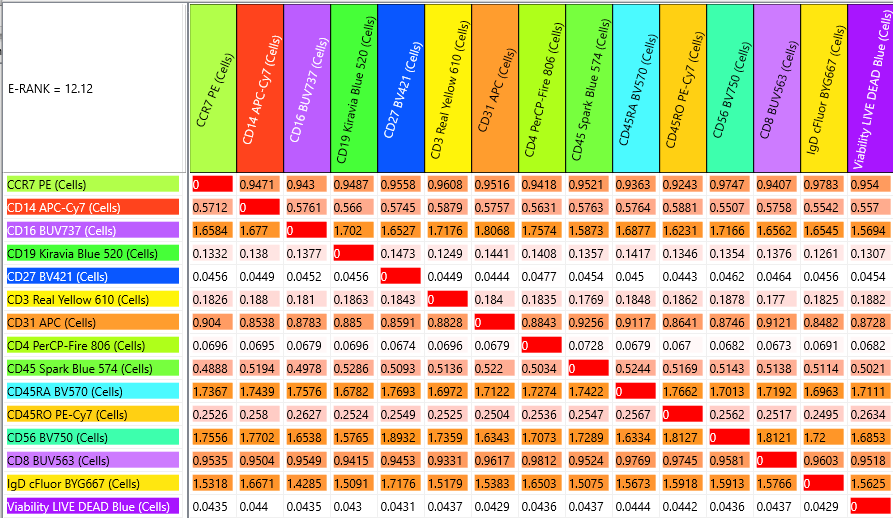
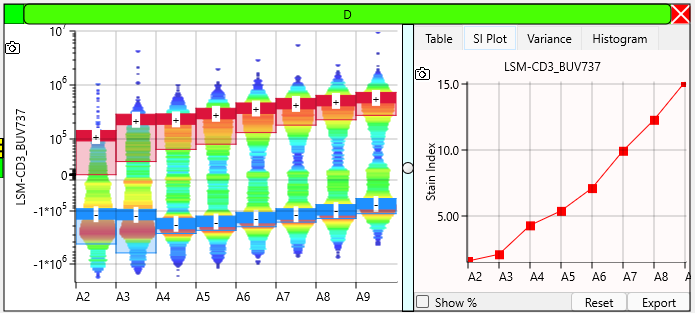
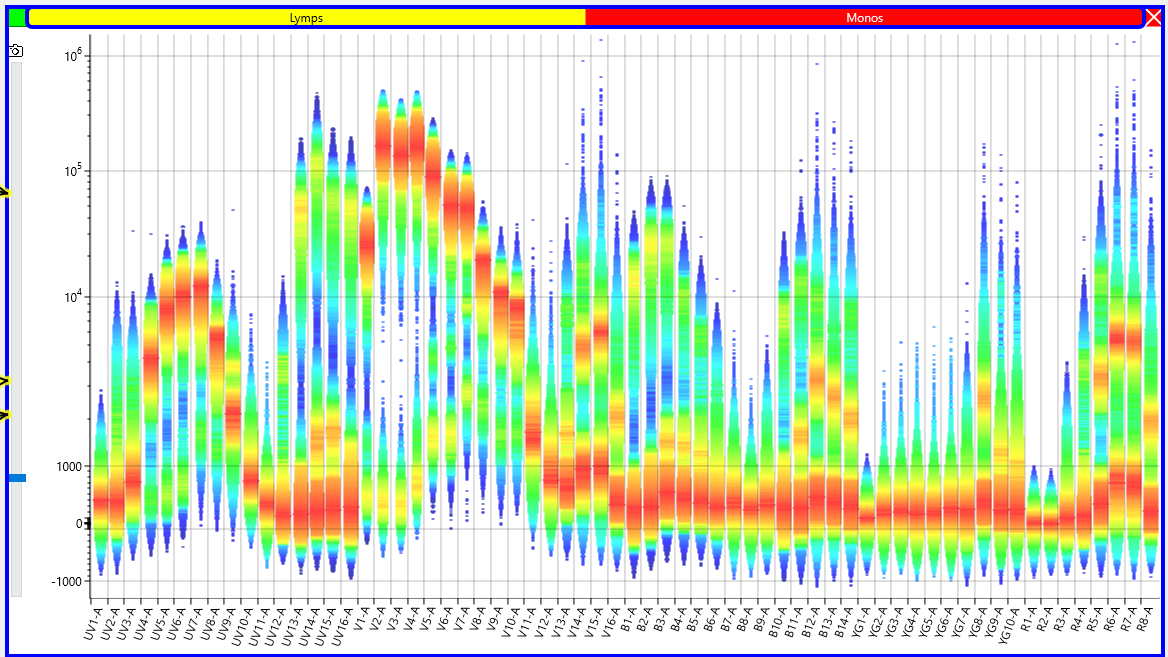
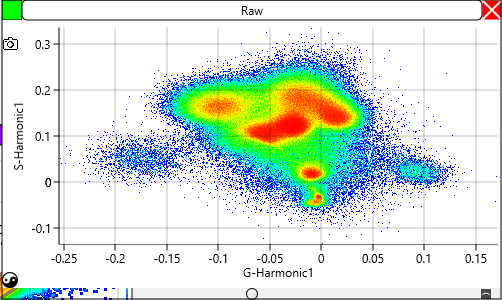
- Opens single FCS files or a whole 96- or 384-well plate as one dataset, so a gate drawn once applies to every well
- Analysis built as a visual gating graph: nodes wired together by dragging, the whole graph saved as one project file
- Polygon, band, quadrant, threshold, well and list gates, plus automatic gating that finds one population per click
- Logic nodes combine gates with AND, OR, NOT and XOR
- Every plot redraws live when a gate, vertex or scale changes - there is no "apply" step
- Plate heat map showing, well by well, how many events reach any node, with a 3-D bar view and plate-shaped CSV export
- Eight axis scales, including log, hyperlog and biexponential (logicle); a scale belongs to the parameter, so every chart of it follows
- Compensation, with a spillover matrix editor and detector linearisation
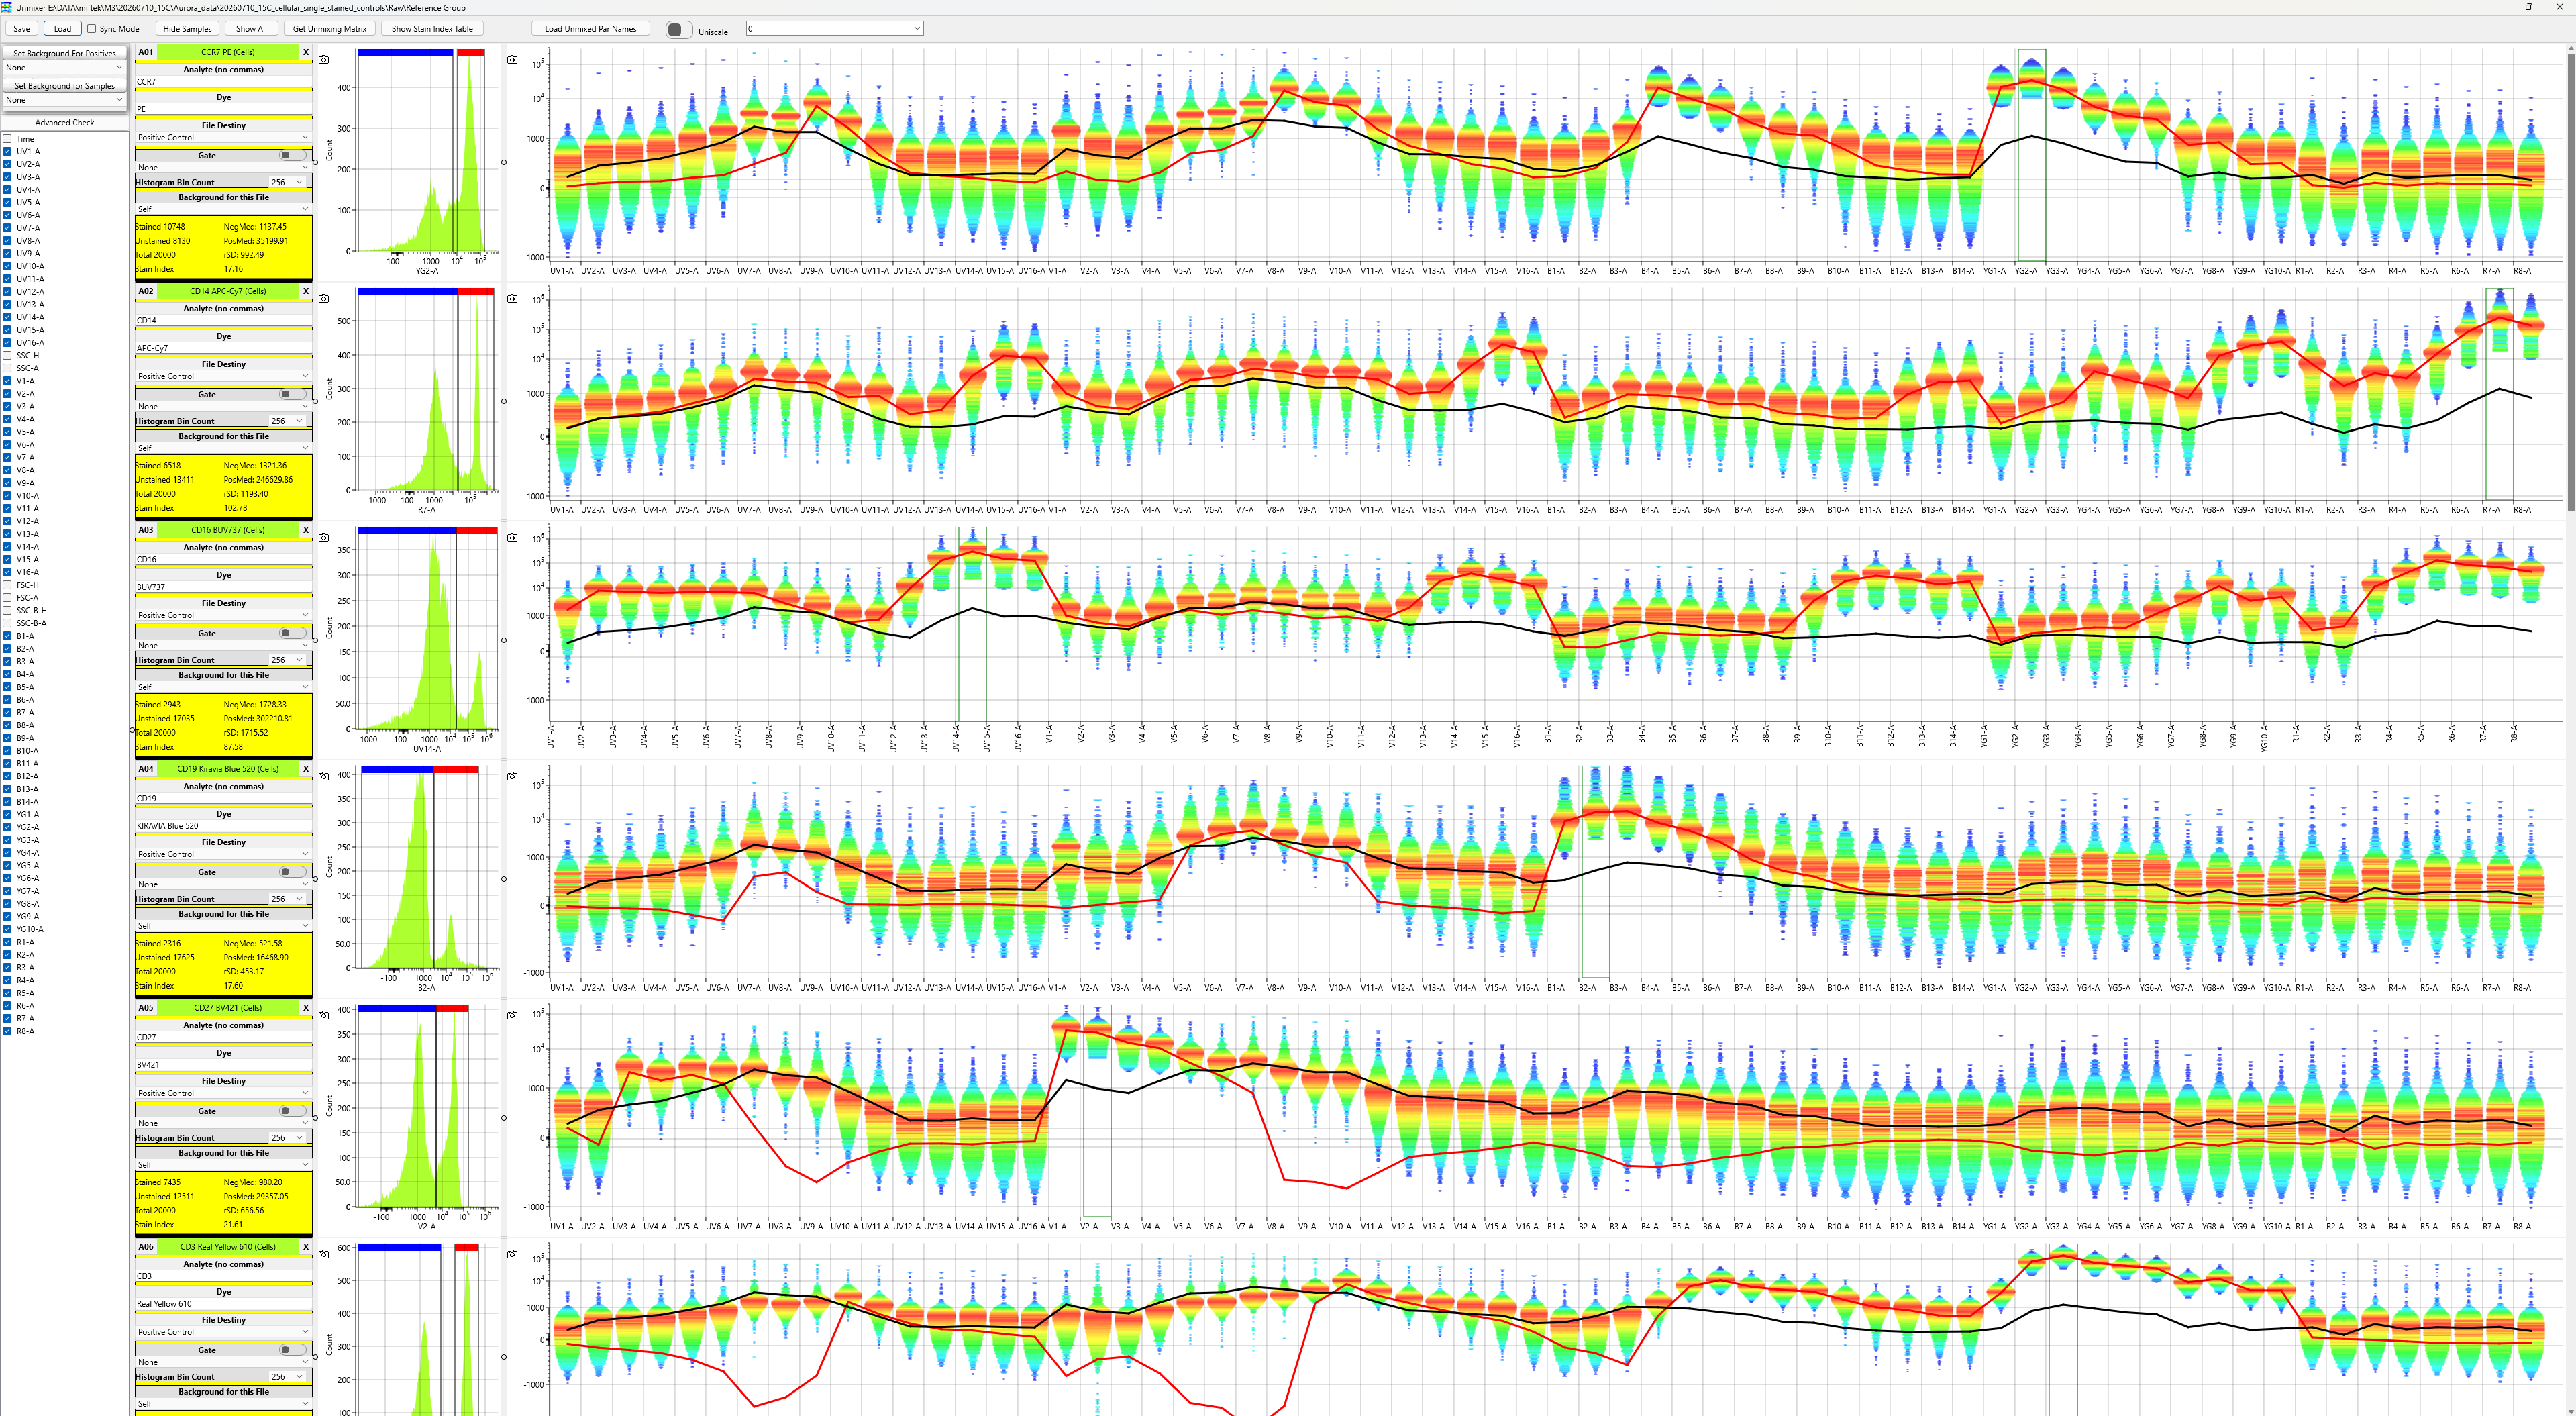
- Spectral unmixing with six solvers, from least squares to Poisson and negative binomial
- Derived parameters - ratios, sums, differences, phasor and unmixed parameters - all gateable
- Ribbon plots of many parameters side by side, and well ribbons for titrations, dose series and timepoints
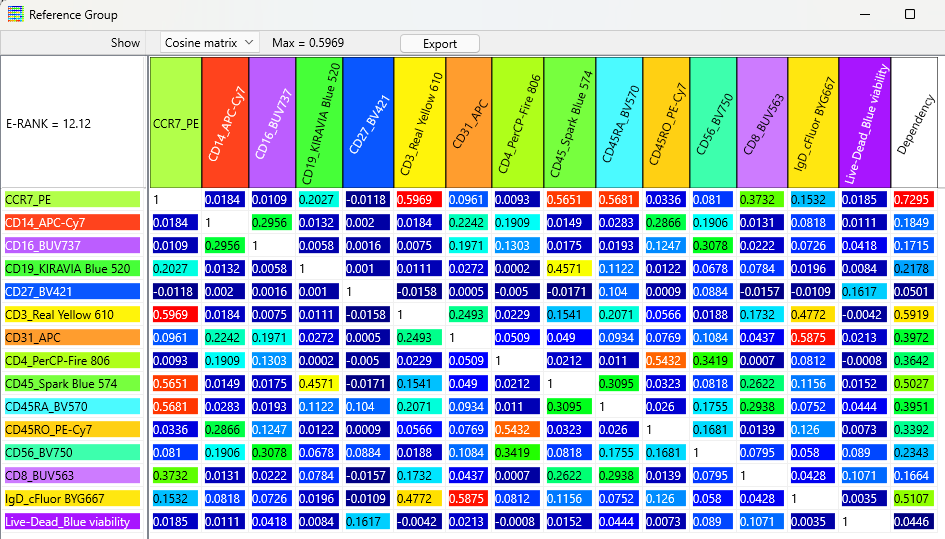
- Spillover spreading matrix from single-stain controls
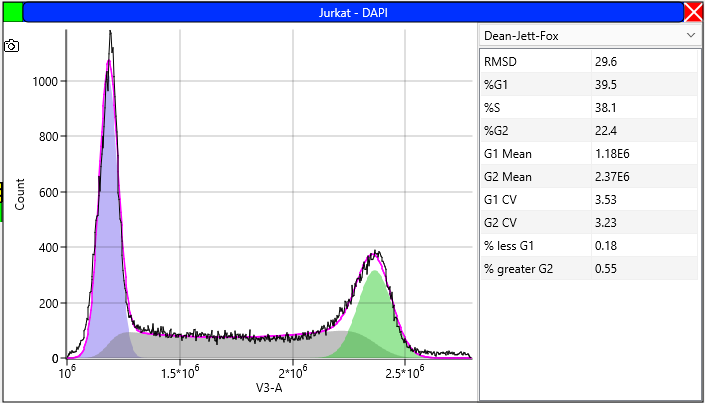
- Cell-cycle analysis with the Dean-Jett-Fox and Watson models
- Dimensionality reduction with PCA, tSNE, UMAP and an autoencoder, with gating on the embedding
- Gate statistics per node, per project and per well; export to CSV, charts to the clipboard, gated events to FCS files
- Gates can be saved and reused on other data
- Preview mode loads part of each file for fast set-up on large plates
- Tabs can be torn off into separate windows
- Built-in manual, opened with F1