Classifying plates
Plates to classify go in the Test Set. Work in Test Mode.

| Button | Tooltip | Does |
|---|---|---|
| Plate, + | Add Plate | Opens .plt files, or with the switch on the database the Database Control Panel |
| Sheet, green arrow left | Import Directory | Opens a plate folder |
| Sheet, green arrow right | Export as PNG file list | Exports the active plate to a folder |
| Plate, - | Remove Selected Plate | Takes the active plate off the list |
| Red cross | Remove All Test Plates | Empties the list |
| Tree diagram | Classify | Classifies all the plates on the list |
| Floppy disk | Save the report at the plate directory | See Reports |
| Clipboard | Print or Export as RTF, HTML or PDF | See Reports |
Classify
Press Classify. Baclan calculates the features of every ticked colony of every plate on the list, then asks the trained SVM about each. It ends on the PCA for SVM tab.
The filters and features used are those of the trained model, whatever the Features tab was showing, and the tab goes back to them.
With no trained model the features are still calculated, and the PCA chart drawn from them, but no classes are given. The Log then says SVM is not trained.
The results
- The table gets each colony's Class and Prob, the probability of that class. Click Prob's heading to bring the doubtful ones together.
- The plate image colours each circle by class, and the legend counts the classes.
The colours are those of the classes in the model, in order.
The PCA for SVM tab
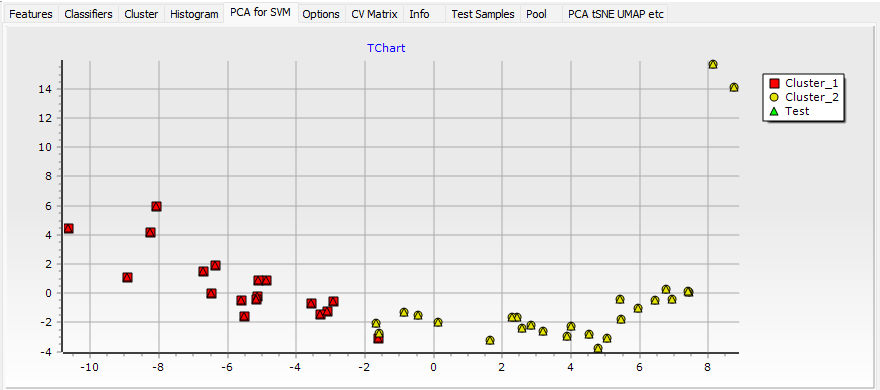
The chart shows the colonies on the first two principal components of the features, one series per class, with a Test series for the colonies of the Test Set in the colours of the classes they were given. Click a point to make its colony active. An arrow points to the active colony.
| Case | What the chart shows |
|---|---|
| After Classify | The components come from the Test Set |
| After training | Empty, unless the model uses PCA, or Do PCA on the Options tab is ticked |
| No trained model | Each plate of the Test Set as a series |
Show Support Vectors on the Options tab draws the colonies the SVM rests on in black, the next time the chart is drawn. Show Colony Numbers on the top toolbar labels the points.
A colony far from all the classes of the model still gets one of them, so this is the place to look for colonies that fit none. Double-click the chart for its editor.
The list of plates
The tree lists the plates, each with its incubation time. Click one to make it active; click its name again to rename it. Double-click one to give it a colour, for the maps. Test Class, above the list, is the name the plates would get with Save Class: see Saving and exporting plates.