Colony Count
Colony Count counts the colonies on the plate image of the active plate, from the image alone. Open it with Count Colonies on the Test Samples tab. It follows the active plate while it is open, and starts counting at once.
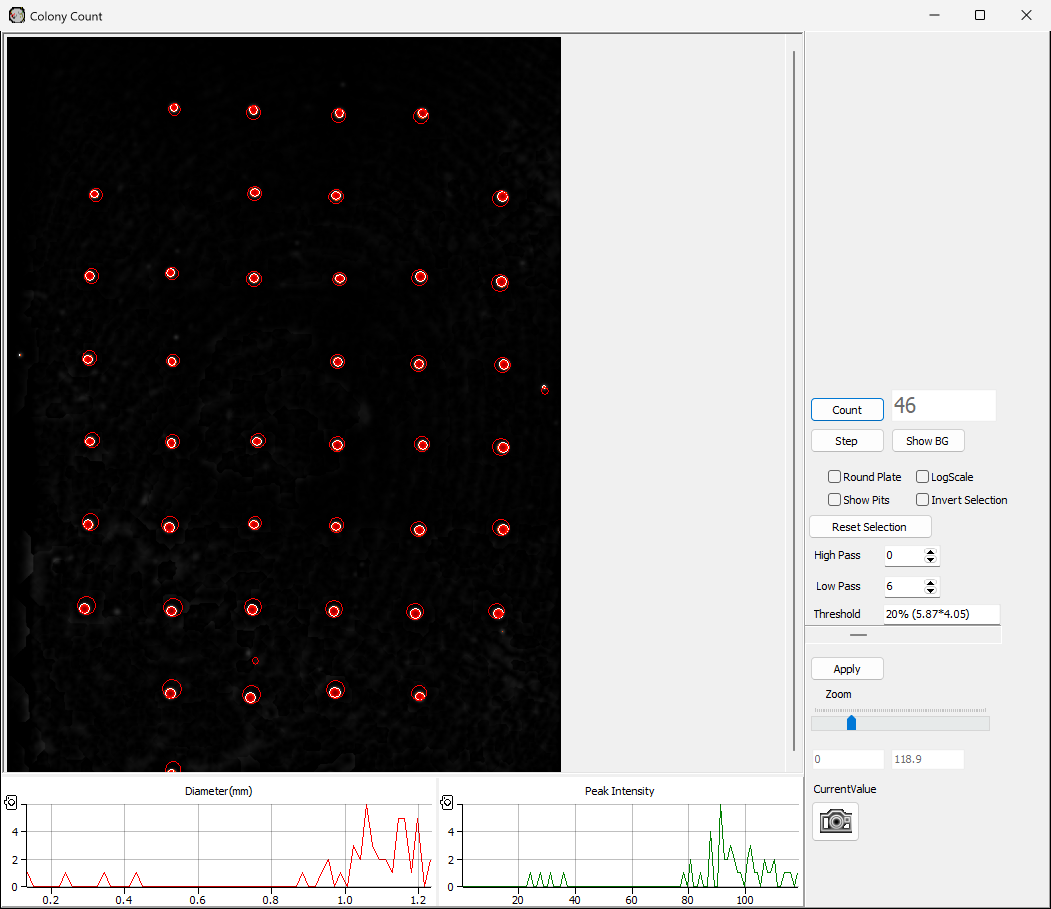
The window shows the filtered plate image with a circle round every colony found, the Diameter(mm) and Peak Intensity histograms of what it found, and the count, in the box beside Count.
How it counts
The image is filtered and its background removed. Every peak above the threshold starts a colony, and each grows until it reaches its edge or another colony.
| Control | Does |
|---|---|
| High Pass, Low Pass | The widths of the filters, in pixels. Low Pass starts at about 0.2 mm, from the plate's DPM. Apply filters the image again and counts |
| Threshold | The scroll bar sets how high a peak must be, in per cent of the range from the lowest value to the highest, which are shown below it. The box beside it shows that per cent, and the noise level times a factor. Counting is done when you let go |
| Count | Counts again |
| Step | Grows the colonies by one step, to watch it work |
| Show BG | Does nothing in this version |
| Round Plate | Looks only inside the central circle. It starts ticked when the image is square |
| Show Pits | Shows the peaks and the hollows found |
| LogScale | Shows the image on a logarithmic scale |
| Zoom | The size of the image on screen |
Counting part of the plate
Drag on the image to draw round the part you want; the colonies inside are counted. Draw again to add another area. Invert Selection counts those outside instead, and Reset Selection forgets them.
As you move the mouse
CurrentValue shows the position on the plate in mm and the value there. The small windows show the image magnified under the cursor, and the scatter image of the colony there, if the plate has one.
The camera button
The button at the bottom opens the image in a window of its own, with the name of the plate, its date and the count, ready to copy.