Finding colonies
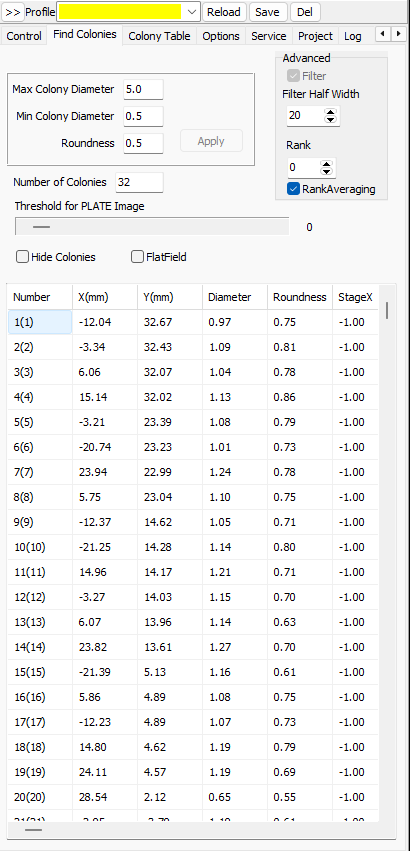
As soon as the plate image is taken, BacBuster looks for colonies on it, and does so again whenever you change one of the settings below. The Find Colonies tab holds the settings and the list of what was found.
How colonies are found
- The plate image is evened out: the background is removed with a filter about as wide as the largest colony, and everything outside the dish is masked.
- Every patch at least as bright as the threshold becomes a candidate colony.
- Candidates smaller than Min Colony Diameter or larger than Max Colony Diameter are dropped. The diameter is that of a circle of the same area, in millimetres.
- Candidates less round than Roundness are kept but not scanned: they show green. Touching colonies that overlap are merged.
- The rest are the colonies that will be scanned: they show red.
The settings
| Setting | Meaning |
|---|---|
| Threshold for PLATE Image | Brightness, 0 to 255, a pixel must reach to belong to a colony. The number beside the slider is its value. Lower finds fainter colonies, and more dust |
| Max Colony Diameter | Largest colony, in mm. Larger patches are not colonies: merged growth, marks, the dish edge |
| Min Colony Diameter | Smallest colony, in mm. Smaller patches are dust or noise |
| Roundness | 0 to 1; 1 is a perfect circle. Colonies less round than this are not scanned. 0 accepts any shape |
| FlatField | Recomputes the evened-out image and finds the colonies again |
| Hide Colonies | Shows the plate image without the red and green colouring |
| Number of Colonies | How many colonies will be scanned |
The threshold acts at once. After typing a diameter or roundness, press Enter or click Apply.
The Advanced box holds the rank filter: Filter Half Width and Rank set it and RankAveraging averages over it. The Filter box itself is disabled in this version.
Which settings for which plate
Media, dishes and growth times call for different settings. Keep each combination in a profile and pick it from the Profile list.
The list of colonies
The table on the tab lists the colonies that will be scanned:
| Column | Meaning |
|---|---|
| Number | Position in the list, and in brackets the colony's number among all colonies found |
| X(mm), Y(mm) | Position on the dish, from its centre |
| Diameter | In mm |
| Roundness | 0 to 1 |
| StageX, StageY | Stage position for the colony, once scanned |
Right-click the table to export it as a text file.
Selecting one colony
Click near a colony on the plate image with the Arrow tool to select it. The yellow label names it, and the chart at the bottom of the Control tab shows its brightness against the distance from its centre - its profile - with straight-line, Gaussian and parabolic fits. The fits show where the colony's edge is, which helps to choose the diameters.